Diagrams
Use HTML diagrams to explain architecture, sequences, state, hierarchy, and flow.
Diagrams make relationships easier to see. HTML diagrams can also animate a sequence, reveal detail, or let someone select a path through a larger system.
Trace one request without flattening the whole system.
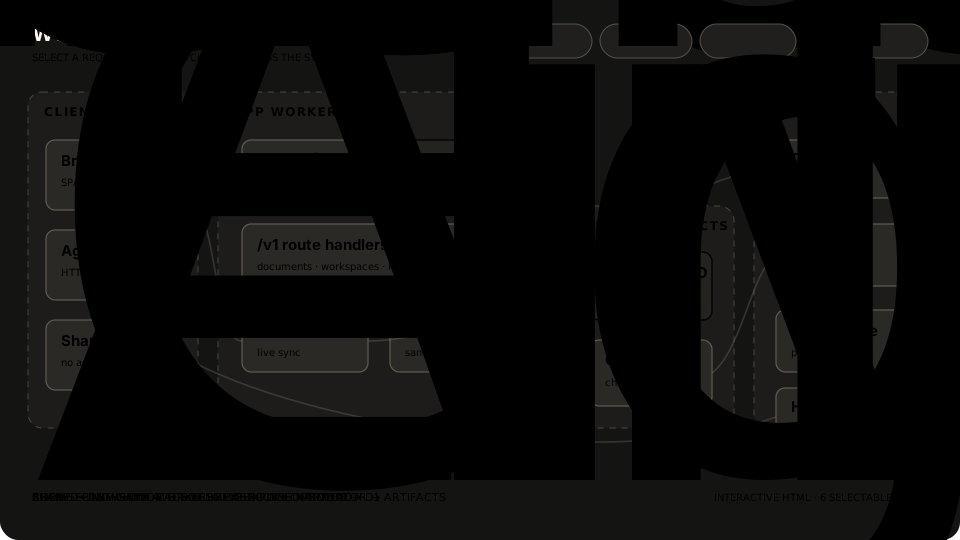
- Boundary
- The architecture remains visible while one request path is emphasized.
- Sequence
- Ordering and handoffs are carried by geometry and motion.
- Exception
- The live artifact lets a reviewer choose a different path.
Common diagram types
- Use a sequence when order and handoff matter.
- Use a state model when transitions and conditions matter.
- Use a hierarchy when ownership or nesting matters.
- Use a flow when material or information moves through a system.
- Use an architecture view when boundaries and dependencies matter.
- Use a timeline when change over time matters.
Do not force every subject into a generic left-to-right process.
Keep it readable
Use a small set of shapes, lines, colors, and labels consistently. Keep dense explanation outside the diagram, and check that labels and paths remain legible at the size people will actually view it.
DecksSee how a browser-native presentation can combine slides, interaction, and motion.